In a previous entry, enhancement of an image was done by grayscale histogram manipulation. In this entry, an image is enhanced by processing it in the frequency domain. The unwanted, repetitive patterns of an image can be omitted by effectively masking the corresponding frequency of this repetitive patterns in the Fourier space. Creating a mask needs the careful consideration of the convolution theorem.
--Some Concepts of the Convolution Theorem and Masks
The following figures are some of the many masks that can be used to filter out unwanted repetitive patterns in an image.


Figure 1: 2 dots (1 pixel size) and its corresponding fourier transform. The dots are symmetric about the center.


Figure 2: 2 circles in place of the dots in figure 1, with increasing radius.


Figure 3: The corresponding FT's of images in figure 2. FT of 2 circles with increasing radius


Figure 4: Squares in place of the dots in figure 1, with increasing width.


Figure 5: The corresponding FT's of the images in figure 4.


Figure 6: Gaussians in place of dots in figure 1, with increasing variance.


Figure 7: The corresponding FT's of the images in figure 6. Order of increasing variance

Figure 8: A set of dirac deltas (10 dirac deltas) convolved with an arbitrary 3x3 pattern. The arbitrary 3x3 pattern is [1,0,1;0,0,0;1,0,1].
Notice that in figure 8, in place where the dirac deltas are supposed to be located, the 3x3 pattern can instead be observed. So, an arbitrary pattern convolved with a dirac delta (or in this case, a set of dirac deltas) results in the replication of that pattern in the location of the dirac delta.

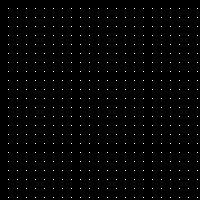

Figure 9: Equally spaced 1's with increasing equidistance among them.


Figure 10: Fourier Transform of the equally spaced 1's (in figure 9)
As stated earlier, these patterns and their corresponding FT's can be used to enhance an image by filtering out unwanted repetitive patterns found in the image. In doing so, only the interesting observables are retained for further analysis.
--Fingerprints and Ridge Enhancement
--Fingerprints and Ridge Enhancement

Figure 11: Grayscale image of a stamped inked finger print. Image taken here.

Figure 12: Corresponding Fourier Transform of the stamped inked finger print image.
Consider the grayscale image of a stamped inked fingerprint shown in figure 11 and its corresponding FT in figure 12. By identifying what and where in the Fourier Space the ridges of the fingerprint corresponds to, the image can be enhanced by filtering out or 'masking' everything else. In doing so, what should be left are the enhanced ridges of the fingerprint, no blotches and the likes, therefore making it easier to analyze further.
It is important to note that in figure 12, the log scale is used in order to display the Fourier Transform of the stamped inked image. This is so because the range of values of the modulus of the FT image will span several orders of magnitude and hence without the log scale, the FT image would be very hard to analyze and process.

Figure 13: Fourier Transform of the stamped inked fingerprint with a mask to remove certain frequencies

Figure 14: Resulting Image after doing IFT on the Figure 13. This image corresponds to a filtered image, enhancing the fingerprint ridges and removing blotches.
Notice that the ridges are quite periodic about the image, and has quite the similarity with sinusoid patterns. Note that the FT of a sinusoid is a pair of symmetric equidistant dots along the axis in which the sinusoid is traversing. With this info, what needs to be done is to filter out everything except those 'collection' of dots, figure 13 shows just that.
Figure 14 shows the resulting image after the filtering process. Notice that the edges of the ridges are quite defined and enhanced.
--Lunar Landing Scanned Pictures: Line Removal
Next up, a picture taken by the unmanned Lunar Orbiter V spacecraft in 1967. The objective is to remove the vertical lines and in the process, 'clean' the image.

Figure 15: An image taken by the Lunar Orbiter V spacecraft


Figure 16: Corresponding FT of the image in figure 15(left) and with mask(right)

Figure 17: Processed image. IFT of the 'masked' FT in figure 16.
Figure 14 shows the resulting image after the filtering process. Notice that the edges of the ridges are quite defined and enhanced.
--Lunar Landing Scanned Pictures: Line Removal
Next up, a picture taken by the unmanned Lunar Orbiter V spacecraft in 1967. The objective is to remove the vertical lines and in the process, 'clean' the image.

Figure 15: An image taken by the Lunar Orbiter V spacecraft
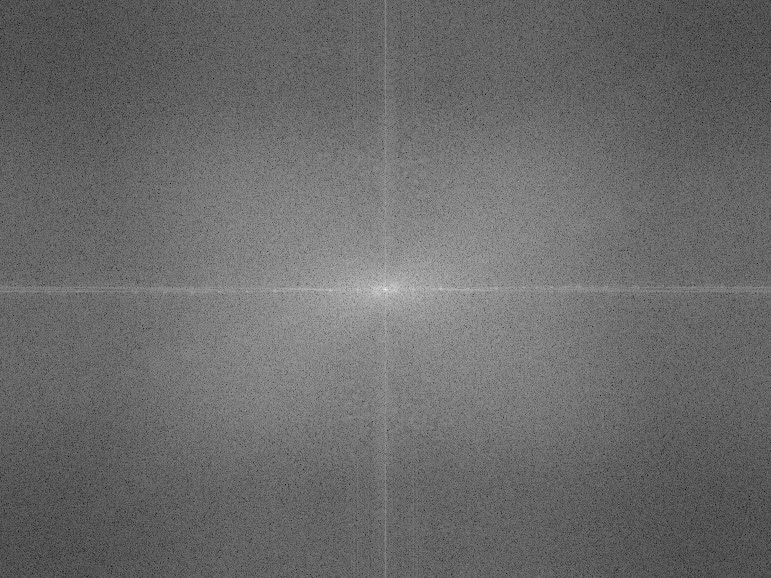

Figure 16: Corresponding FT of the image in figure 15(left) and with mask(right)

Figure 17: Processed image. IFT of the 'masked' FT in figure 16.
Note that if the vertical lines are to be omitted, its corresponding frequency in the Fourier Space must be filtered out. Again, the vertical lines resemble that of a sinusoid (FT of a sinusoid is a pair of dots along the axis in which the sinusoid traverses), therefore, by filtering out the set of dots which corresponds to these vertical lines, these lines can then be filtered out in the original image.
--Canvas Weave Modeling and Removal

Figure 18: An oil painting from the UP Vargas Museum collection


Figure 19: FT of the oil painting in figure 18 (left) and with a mask (right)

Figure 20: Resulting image. IFT of the 'masked' FT.

Figure 21: Appearance of the canvas weave. This is what was filtered during the filtering process.
--Canvas Weave Modeling and Removal

Figure 18: An oil painting from the UP Vargas Museum collection
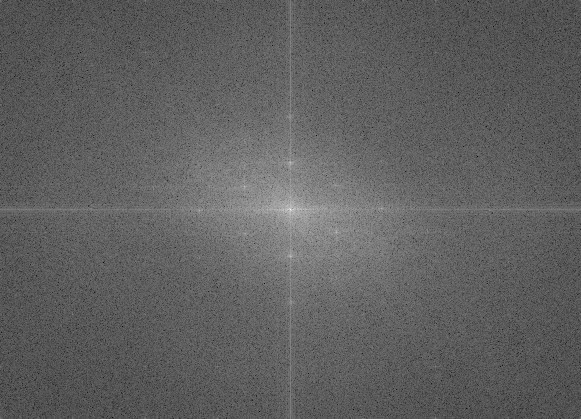

Figure 19: FT of the oil painting in figure 18 (left) and with a mask (right)

Figure 20: Resulting image. IFT of the 'masked' FT.

Figure 21: Appearance of the canvas weave. This is what was filtered during the filtering process.
Figure 18 shows an oil painting with obvious canvas weave. What needs to be done is to filter out this canvas weave in order to better appreciate the painting itself. Figure 21 shows an image of the filtered out canvas weave. Once the canvas weave is filtered out, the painting itself can be better analyzed and appreciated.
==
Technical Correctness: 4/5 (due to late posting and some vague discussions)
Quality of Presentation: 5/5
==
Technical Correctness: 4/5 (due to late posting and some vague discussions)
Quality of Presentation: 5/5
No comments:
Post a Comment