For this activity, the skill to pick out the region of interest (ROI) from the rest of the image is developed. Selection rules are based on the unique features of the ROI. One quick way to segment the ROI from the rest of the image is to convert the image into grayscale then set some threshold value to isolate the ROI, but this method does not always guarantee success. The case for grayscale images is that, more often than not, the ROI has the same or overlapping grayscale values as the background, making it relatively impossible to isolate the ROI for further processing.
Another way to segment images is by use of color, and its application can be seen in face and hand recognition, isolation of land cover in remote sensing, and cell identification in microscopy.
Inherently, 3D colored objects will have shading variations and in some extent this shadow variations can be thought of as differing brightness of the same color. It is recommended that the color space be represented not by RGB alone but by a coordinate system in which the brightness information is separated from the chromaticity (pure color) information. One such color space that can do this is the Normalized Chromaticity Coordinates or the NCC.
Consider an image, per pixel of that image, let its intensity be I = R+B+G (the primary colors). Then the NCC are

with r+g+b = 1. This implies that r,g, and b can only have values from 0 to 1, and the calculation of b is dependent of r and g, meaning b = 1 - r - g. With this, it is actually enough to represent chromaticity just by 2 coordinates (r and g). All in all, the color space has been transformed from the R G B to the r g I, where r and g contains the chromatic information and the I contains the brightness information.

Figure 1: Normalized Chromaticity Space. x-axis is red (r) and y-axis is green (g).
Figure 1 shows the NCC. Due to the transformation, the color information has been reduced from 3 dimensions to just 2. It can be observed that when r = 0 and g = 0, b = 1, indicating that the origin corresponds to blue. As observed in figure 1, any color can be represented in the NCC.
Parametric vs. Non-Parametric Probability Distribution
Segmentation based on color can be performed by determining the probability that a pixel, with a certain color belongs to a certain color distribution of interest. The color distribution of interest can be obtained by cropping a part of the image that contains the color distribution of interest.
To indicate if a pixel belongs to the region on interest or not, its probability of being part of the ROI must be determined. Since the space/coordinates used contains r and g, a joint probability function (p(r)*p(g)) can be defined to test the likelihood of a pixel to belong to the ROI. For this experiment, it is assumed that the probability function is a Guassian distribution function given by

with p(g) being the same function but with a sigma (variance) and mean for g.  ,
,  and
and  ,
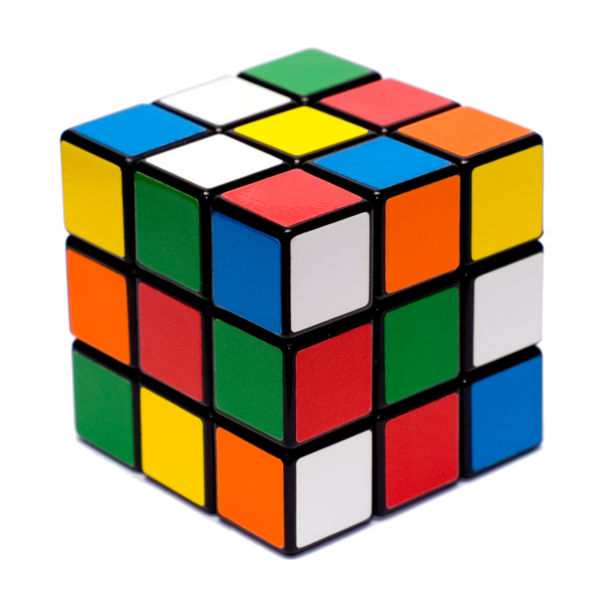
,  can be derived from the pixel samples of the cropped ROI using the stdev() and mean() functions respectively. r is the corresponding red color value of a certain pixel in the original image, and g in p(g) being the corresponding green color value of the same pixel. Depending on the value of p(r)*p(g), certain pixels will light up while others will be blackened. Figure 2 shows the result of applying this algorithm on an image of a rubix cube with the ROI being the yellow color enclosed in a rectangle.
 ,
,  and
and  ,
,  can be derived from the pixel samples of the cropped ROI using the stdev() and mean() functions respectively. r is the corresponding red color value of a certain pixel in the original image, and g in p(g) being the corresponding green color value of the same pixel. Depending on the value of p(r)*p(g), certain pixels will light up while others will be blackened. Figure 2 shows the result of applying this algorithm on an image of a rubix cube with the ROI being the yellow color enclosed in a rectangle.


Figure 2: Rubix Cube (left) taken from here. Right image is the result after applying the parametric algorithm.
Notice that in figure 2, although there is more than 3 yellow colored region, not all of them are highlighted, this is probably due to the different shading of the color yellow in the image.
Non-Parametric
Non-Parametric method makes use of the 2d color distribution histogram of an image and the specified ROI. The histogram itself is used to identify pixels (based on their color) that belongs to the ROI. Histogram backprojection can be used to give a certain pixel location (in the original image) its corresponding value based on the histogram of the cropped ROI. The code below is a sample code of implementing a 2d histogram in scilab. (souce code given by Dr. Soriano in her handout for this activity)
I = double(I); //I is the image of the region of interest
R = I(:,:,1); G = I(:,:,2); B = I(:,:,3);
Int= R + G + B;
Int(find(Int==0))=100000;
r = R./ Int; g = G./Int;
BINS = 32;
rint = round( r*(BINS-1) + 1);
gint = round (g*(BINS-1) + 1);
colors = gint(:) + (rint(:)-1)*BINS;
hist = zeros(BINS,BINS);
for row = 1:BINS
for col = 1:(BINS-row+1)
hist(row,col) = length( find(colors==( ((col + (row-1)*BINS)))));
end;
end;
scf(2); imshow(hist,[]);


Figure 3: 2d histogram of the Rubrix cube (left) and 2d histogram of the cropped ROI. Note that the y-coordinates in scilab are inverted.

Figure 4: Result after applying the non parametric algorithm. The ROI is the yellow color.
--
Technical Correctness: 4/5 (late posting)
Quality of Presentation: 5/5
end;
scf(2); imshow(hist,[]);


Figure 3: 2d histogram of the Rubrix cube (left) and 2d histogram of the cropped ROI. Note that the y-coordinates in scilab are inverted.
Figure 3 shows the histogram of the image of the rubrix cube and the cropped ROI. Note that the y coordinates are inverted. This histogram correlates to the colors indicated in figure 1. Notice that the colors of the image and the cropped ROI match the colors indicated in the chromaticity space.

Figure 4: Result after applying the non parametric algorithm. The ROI is the yellow color.
Again, not all yellow colored regions are highlighted.
As observed there is quite a difference in using the parametric and non parametric methods to isolate the Region of Interest. The parametric method basically makes use of the probability distribution while the non parametric method makes use of the 2D color histogram of the image. The use of analytic functions in the parametric method is only as efficient as the fit of the PDF function used. On the other hand, no calculations are needed in the non parametric method, only a look-up of the histogram information.
For me, it is better to use the non-parametric method in isolating/segmenting the ROI from the rest of the image.
I would like to acknowledge my discussions with Arvin Mabilangan.
--
Technical Correctness: 4/5 (late posting)
Quality of Presentation: 5/5
No comments:
Post a Comment